

Designing an effective portfolio strategy will be one of the key challenges for companies during the recovery period from the coronavirus crisis. Now, more than ever, companies need to assess their portfolios and optimize their investments and returns.
To touch upon this subject, we analyzed BCG (Growth Share) Matrix and GE – McKinsey Matrix in our previous articles. Both tools are aimed at optimizing portfolios via prioritization of investments. In this article, we will examine another portfolio optimization tool, FITMINDS Portfolio Optimization Tree, which we have developed for one of our clients which has near a thousand SKUs, hundreds of brands, and more than ten categories. However, before starting to explain FITMINDS Portfolio Optimization Tree, it would be better to go over the Sales-Profitability Matrix which lays out the basic principles of FITMINDS Portfolio Optimization Tree.
Sales – Profitability Matrix
Sales – Profitability Matrix is a practical tool to devise a portfolio strategy that helps you to decide where and how to use your resources. It is a matrix that analyzes business units/products in terms of two measures:
- Profitability
- Share in total sales
Firstly, it looks at how profitable a business unit/product is. Then, it classifies each of them as low or high profitability. Measuring profitability might differ greatly between different industries. What classifies as low profitability in an industry might be considered high profitability in another industry. Therefore, you need to understand the cost structure of your industry and classify your business units or products accordingly.
Secondly, it looks at what percentage of total sales of a company is constituted by a business unit/product. Like the previous measure, it classifies them as low or high share. You need to be careful with this classification and tailor your decisions in line with the overall strategy of your company. Furthermore, you need to consider the growth potential of business units/products. In other words, a business unit/product might have a low share in total sales, but it could have growth potential, or it might be of strategic importance to your company. When using the model, you should keep these in mind.
How to Use Sales – Profitability Matrix?
As can be seen from the chart below, you should start by putting “profitability” in the x-axis and “share in total sales” in the y-axis. Then, you need to plot your business units/products on the matrix.
Business units/products that have low shares in total sales and low profitability should be delisted. Those that have high profitability but very low share in total sales should be delisted, too, unless they are strategic business units/products. Since they do not contribute much to total sales but use the company’s resources, they had better be delisted.
However, those that have high profitability but low share in total sales should be enlarged. The aim should be to increase their sales without compromising profitability. In other words, they need to be moved to the top-right section of the matrix.
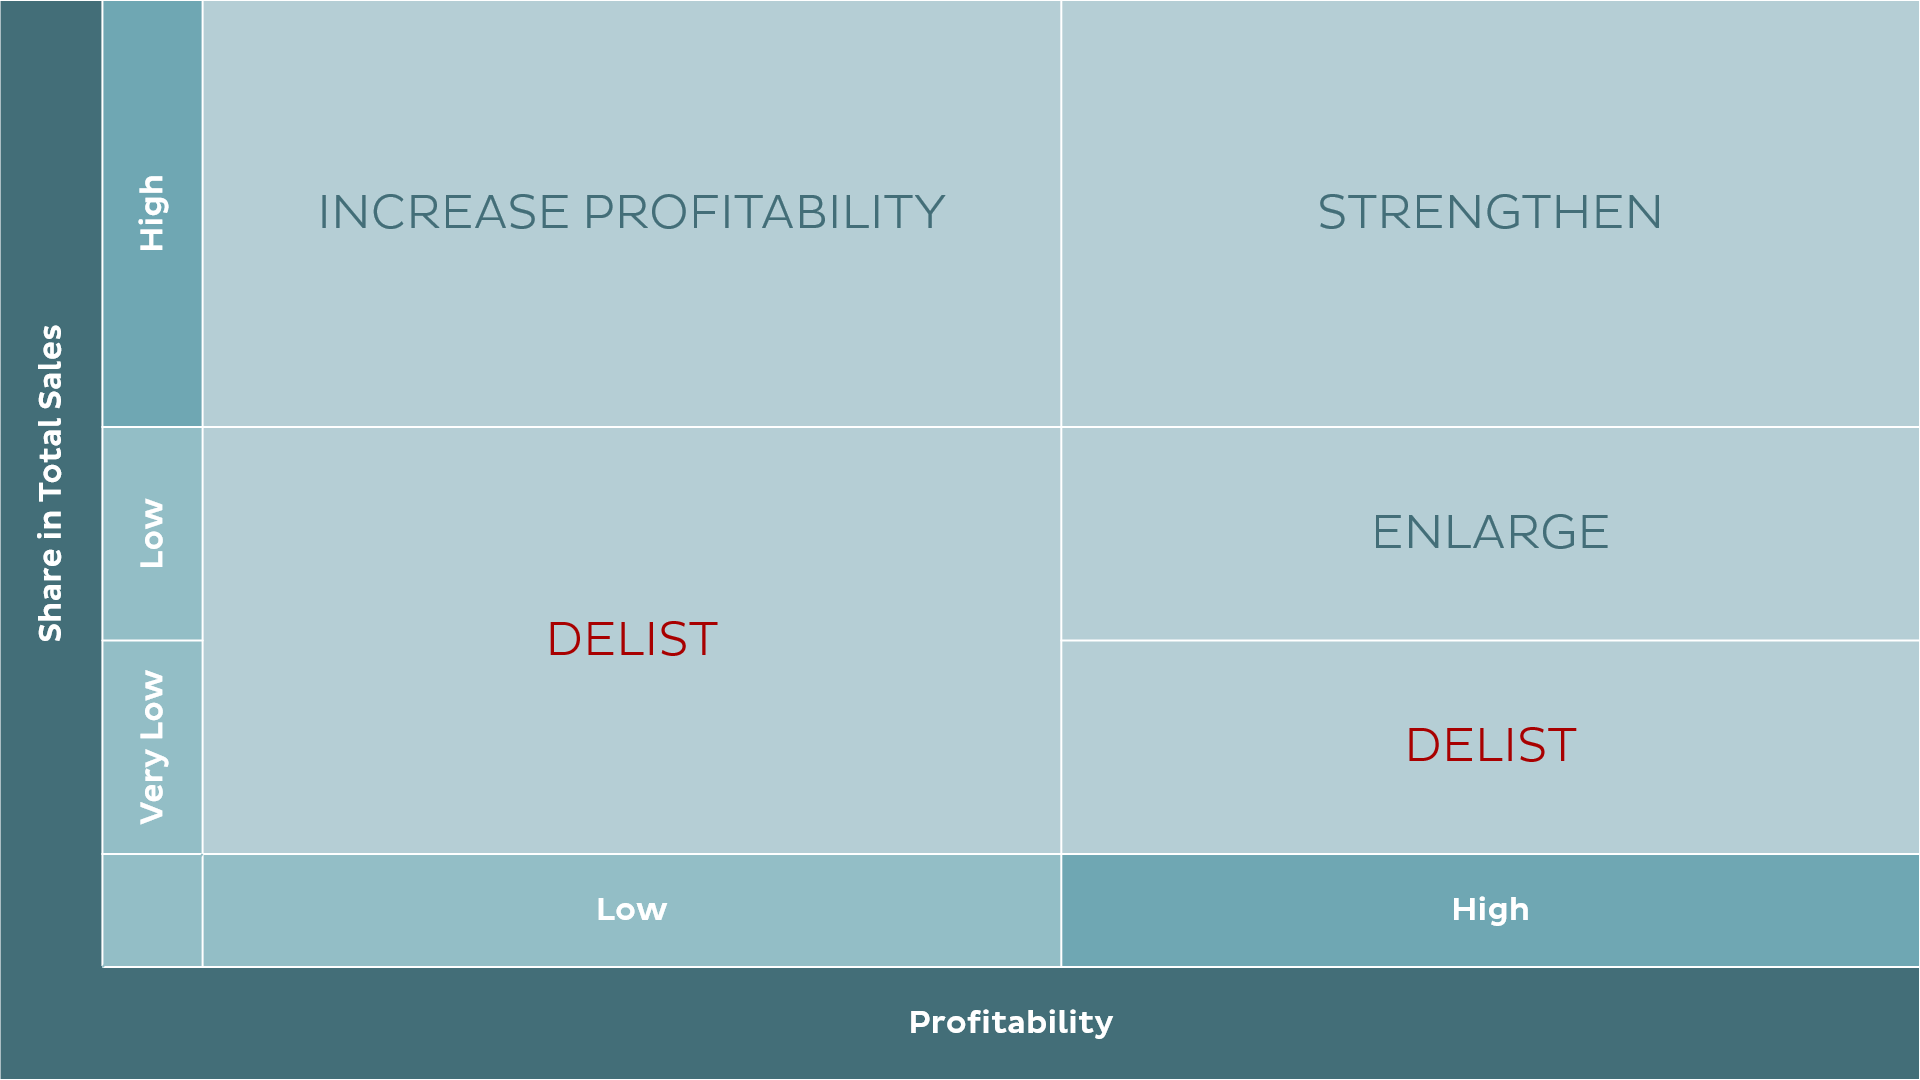
For business units/products that have high shares in total sales but low profitability, you need to find ways to increase their profitability without compromising sales. It can be done by redesigning cost structure to achieve cost reductions.
Business units/products that have both high profitability and high share in total sales should be strengthened. You need to do everything you can to keep them on the top-right section of the matrix. You can achieve this by better allocating your resources to support this group.
FITMINDS Portfolio Optimization Tree
In addition to the sales – profitability matrix, FITMINDS Portfolio Optimization Tree considers the growth potential of products or SKUs and the discount applied to them. As can be seen below, it starts by looking at their share in total sales. Secondly, it looks at their profitability. Thirdly, it analyzes their growth potential and the discount applied to them. As a result, it provides you with a list of the strategies that are most suitable for each scenario. Now, we will analyze the Tree starting from the bottom.
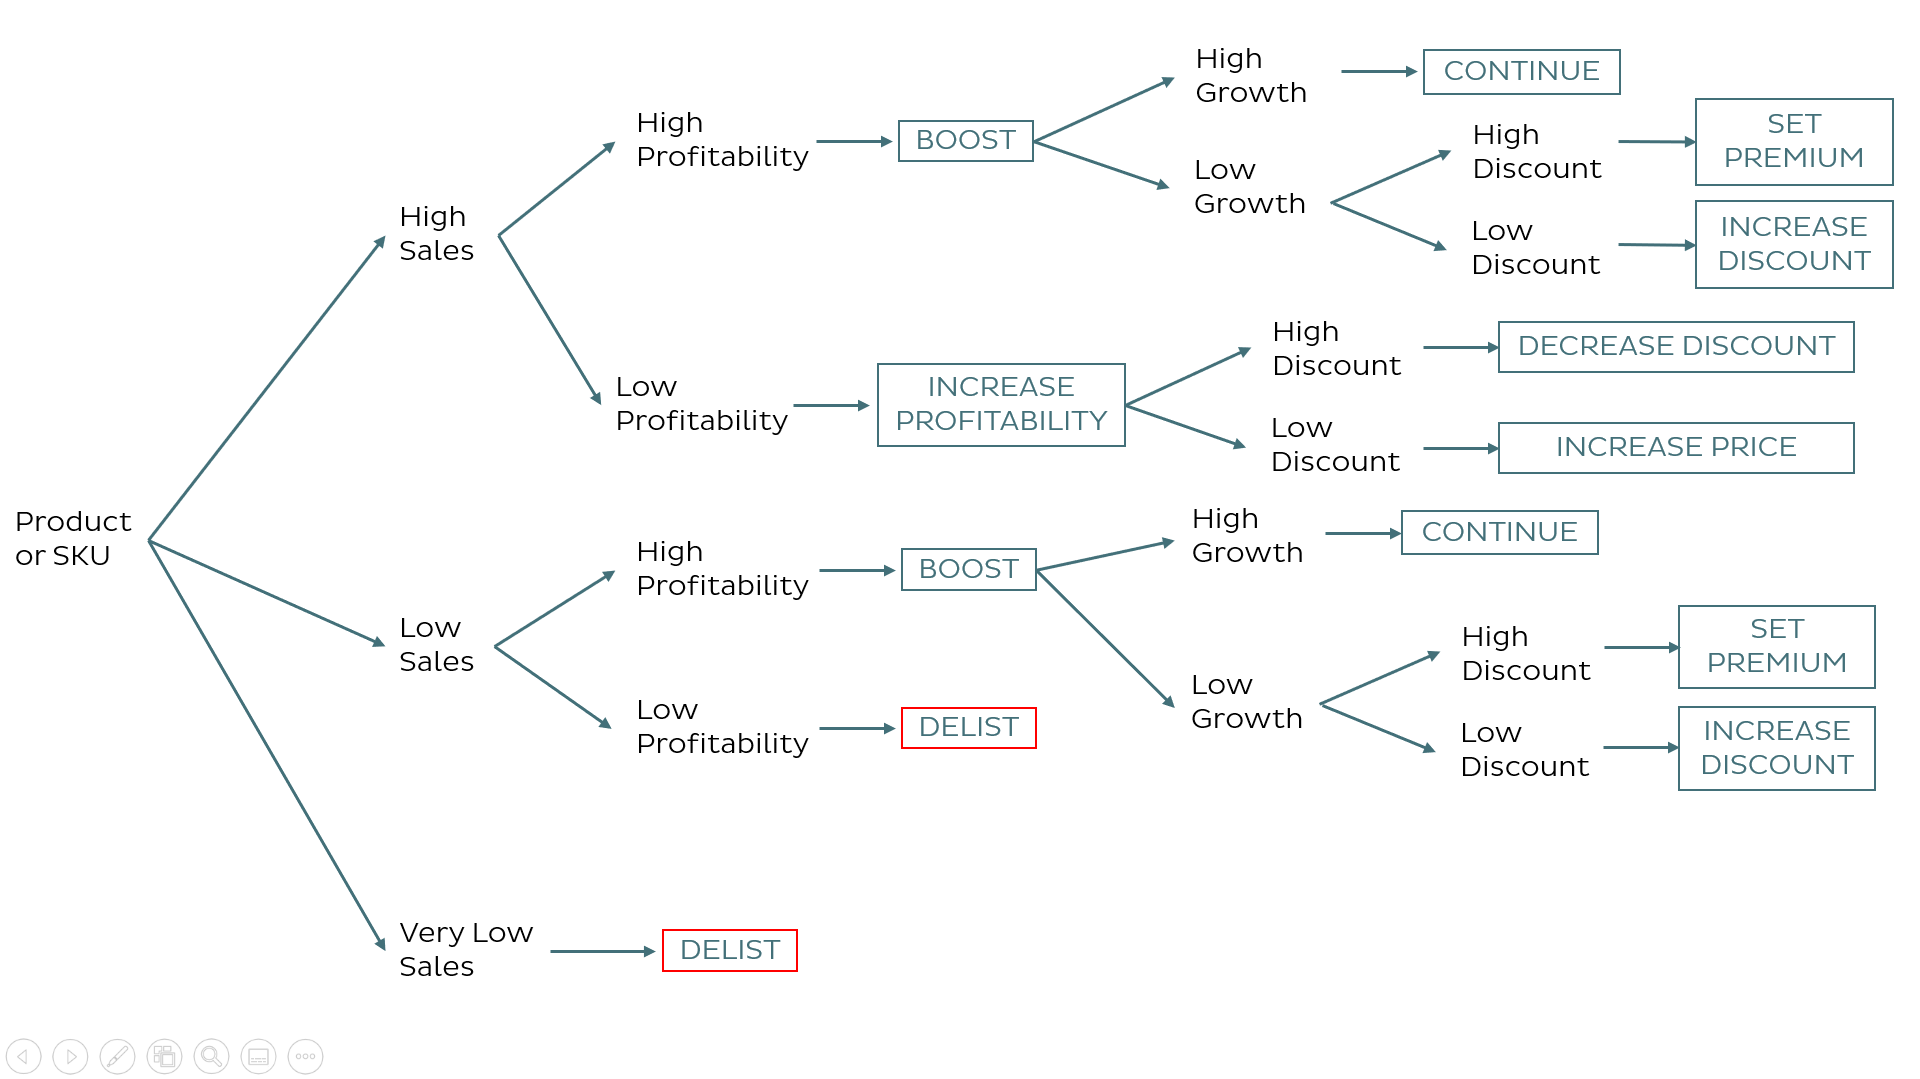
Products or SKUs that have very low shares in total sales should be delisted regardless of their profitability if they are not new products.
For products or SKUs with low sales, you should check profitability. If their profitability is low too, they should be delisted. However, if they have high profitability, you should aim to boost them by increasing sales. At this point, you should look at the growth rate of these products or SKUs. If they have low growth rates, the next variable you should be looking at is the discount that is being applied to them. If the discount is low, you can increase it to boost sales. However, if the discount rate is already high, you can set premiums for these products or SKUs to encourage your sales force. For products or SKUs that have high profitability along with high growth rates, you do not need to do anything at this point.
Now, moving to the top of the tree, for products or SKUs with high sales, you should check their profitability as in the previous case. For those with low profitability, you should be looking for ways to increase profitability without compromising sales. Now, you should check the discount being applied to these products or SKUs. If the discount is already low, you can increase the price. If it is high, you can reduce the discount. For those with high sales and high profitability, you should check the growth rate. If the growth rate is low, the next variable to check is the discount rate. If the discount is low, you can increase it. If it is already high, you can set premiums on these to encourage your sales force. Finally, you do not need to take any action for products or SKUs with high sales, high profitability, and high growth.
Conclusion
Crafting an effective portfolio strategy might be tricky, especially during post-crisis periods. FITMINDS Portfolio Optimization Tree, taking more variables into account compared to BCG Matrix and McKinsey Matrix, offers an analytical approach to manage your portfolio and allows you to get the highest possible return on your investments. You need to make use of all these models and develop an approach that is most suitable for your own needs and your industry’s specifications.
Contact us for a comprehensive assessment of your portfolio to optimize your investments and returns.

